Every completed project is a lesson. The question is whether you're capturing those lessons or letting them walk out the door when the job closes.
The best estimators don't just guess better—they've built systems to learn from every project they've done. Here's how to build yours.
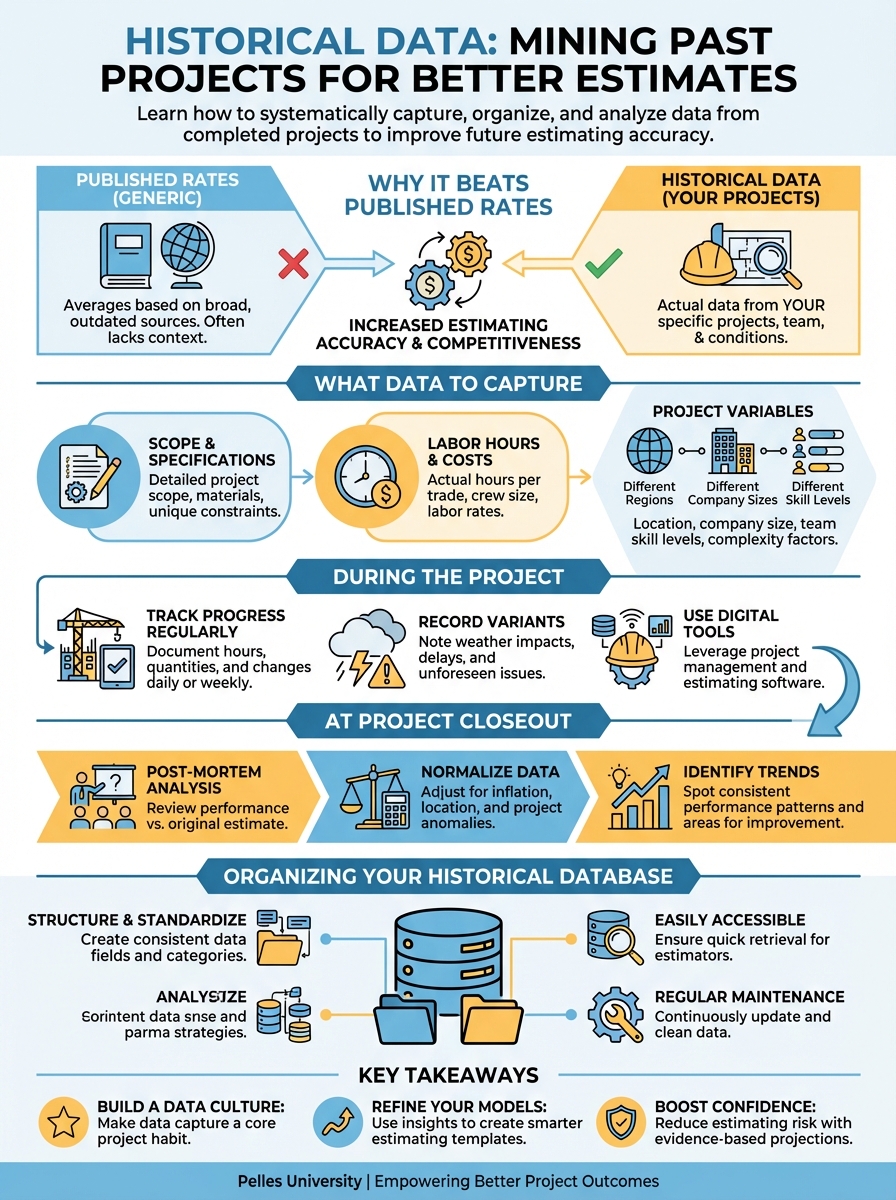
Why Historical Data Beats Published Rates
Industry-published labor rates are averages across:
- Different regions
- Different company sizes
- Different skill levels
- Different methods and tools
Your data reflects your reality:
- Your crews' productivity
- Your methods and equipment
- Your market conditions
- Your management approach
A 20% difference from published rates isn't unusual—and knowing your actual rates is the difference between making money and wondering where it went.
What Data to Capture
During the Project
Labor tracking:
- Hours by task/system
- Crew composition (journeymen vs. apprentices)
- Conditions encountered (access, stacking, weather)
- Delays and their causes
Material tracking:
- Actual quantities vs. estimated
- Waste percentages
- Procurement issues
- Price changes from estimate
Progress tracking:
- Productivity rates achieved
- What slowed things down
- What went better than expected
At Project Closeout
Cost summary:
- Final labor cost vs. estimate
- Final material cost vs. estimate
- Subcontractor cost variances
- Change order net impact
Scope analysis:
- What was actually built vs. estimated
- Scope additions and reductions
- Design changes encountered
Lessons learned:
- What would you estimate differently?
- What conditions weren't anticipated?
- What went well to repeat?
Organizing Your Historical Database
Project Classification
Categorize projects for meaningful comparison:
| Category | Options |
|---|---|
| Building type | Office, healthcare, industrial, retail, education |
| Project type | New construction, renovation, tenant improvement |
| Size range | Small (under $100K), medium ($100K-$500K), large (over $500K) |
| Complexity | Simple, standard, complex |
| GC/client | Track by relationship |
Unit Metrics
Calculate comparable metrics:
By area:
- Cost per square foot
- Labor hours per square foot
- Material cost per square foot
By system:
- Cost per ton (HVAC)
- Cost per fixture (plumbing)
- Cost per device (electrical)
- Cost per head (fire protection)
By unit:
- Hours per linear foot of pipe/conduit
- Hours per diffuser/device
- Hours per fixture
Variance Tracking
For every project, calculate:
- Labor variance (actual vs. estimated)
- Material variance
- Overall variance
- Variance percentage
Track patterns:
- Are you consistently over or under on certain items?
- Which building types have highest variance?
- Which GCs correlate with better/worse outcomes?
Analyzing Your Data
Finding Patterns
Look for correlations:
Query: What factors correlate with labor overruns?
- Building type?
- Project size?
- GC relationship?
- Schedule duration?
- Complexity factors?
Identifying Outliers
When projects significantly beat or miss estimates:
- Document the variance (how much, which categories)
- Identify the cause (scope change? productivity issue? estimating error?)
- Determine if systemic (will this happen again?)
- Adjust accordingly (update rates, factors, or checklists)
Building Benchmarks
From sufficient data, establish:
| Metric | Low | Average | High |
|---|---|---|---|
| Electrical $/SF (office) | $18 | $24 | $32 |
| Plumbing $/fixture | $1,800 | $2,400 | $3,200 |
| HVAC $/ton | $3,500 | $4,500 | $6,000 |
| Fire protection $/head | $180 | $240 | $320 |
Your ranges, based on your history.
Using AI for Historical Analysis
AI can help find patterns in your data:
Pattern Recognition
I have cost data from 50 completed electrical projects including:
- Building type
- Square footage
- Final cost
- Labor hours
- Estimated vs. actual variance

Analyze this data and identify:
1. Average cost per SF by building type
2. Factors that correlate with cost overruns
3. Projects that were outliers and possible reasons
4. Trends over time
Predictive Benchmarking
Based on this historical data, what should I expect for:
- A 50,000 SF office building
- Standard complexity
- 6-month schedule
- New construction

Provide expected ranges for:
- Total electrical cost
- Cost per SF
- Labor hours
- Material cost percentage
Lessons Learned Synthesis
Review these closeout reports from 10 similar projects.
Summarize:
1. Common estimating misses
2. Conditions frequently not anticipated
3. Recommendations that repeat across projects
4. Suggested checklist items for future estimates
Building the Habit
Make Data Capture Easy
- Use templates for project closeout
- Require data as part of closeout process
- Tie to final payment processing
- Keep it simple—capture key metrics, not everything
Review Regularly
- Monthly: Review recent project closeouts
- Quarterly: Update benchmark rates
- Annually: Comprehensive analysis and rate adjustment
Share the Knowledge
- Estimators should see project outcomes
- Project managers should understand estimate assumptions
- Create feedback loops between field and estimating
Quick-Start Historical Data Template
At minimum, capture for every project:
Project info:
- Project name and type
- Square footage
- Contract value
- GC and owner
Cost summary:
- Estimated labor cost → Actual labor cost
- Estimated material cost → Actual material cost
- Net change orders
- Final margin
Key metrics:
- Final cost per SF
- Labor hours per SF
- Major variance explanations
Lessons:
- Top 3 things to estimate differently next time
Common Pitfalls
Pitfall 1: Not Normalizing Data
A project with overtime, difficult access, and trade stacking isn't comparable to one with ideal conditions. Normalize or note conditions.
Pitfall 2: Ignoring Small Projects
Small projects often have higher per-unit costs (mobilization, minimum charges). Track them separately from large projects.
Pitfall 3: Blaming Estimating for Field Issues
Not every variance is an estimating error. Separate:
- Estimating misses (wrong quantities, wrong rates)
- Field issues (productivity problems, rework)
- Scope changes (not estimating's fault)
Pitfall 4: Analysis Paralysis
Start simple. Basic variance tracking beats elaborate systems you don't use.
What's Next
Historical data improves future estimates. But even perfect estimates don't help if you can't collect on your work. Next, look at change order management—documenting and negotiating the extra work that inevitably emerges.
TL;DR
- Your completed project data is more valuable than published industry rates
- Capture data throughout the project and at closeout
- Organize by building type, size, and complexity for meaningful comparison
- Use unit metrics (cost/SF, hours/fixture) to compare different-sized projects
- Analyze patterns and outliers to improve future estimates
- Use AI to find patterns in large datasets
- Start simple—basic tracking beats elaborate unused systems