Your estimate is only as good as your labor hours. Material costs come from quotes. Equipment costs are calculable. But labor? That's where estimates go wrong.
The difference between winning profitable work and bleeding money often comes down to how accurately you estimate labor productivity.
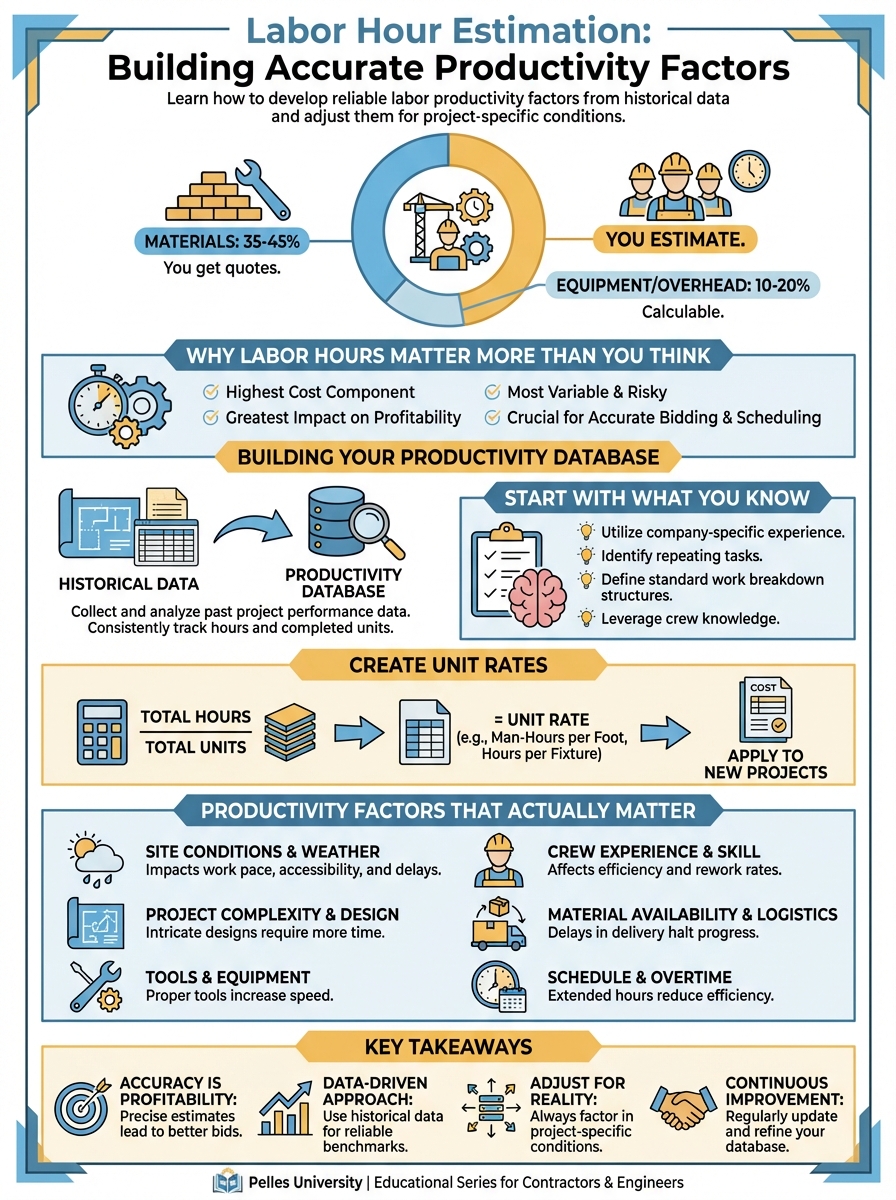
Why Labor Hours Matter More Than You Think
Consider a typical MEP project:
- Materials: 35-45% of cost (you get quotes)
- Labor: 40-50% of cost (you estimate)
- Equipment/overhead: 10-20% of cost (calculable)
If your material pricing is off by 5%, you lose maybe 2% of total cost. If your labor estimate is off by 20%, you lose 8-10% of total cost. On a $500,000 job, that's $40,000-$50,000 in margin.
Building Your Productivity Database
Start With What You Know
The best labor data comes from your own completed projects. Start tracking:
Per task:
- Actual hours vs. estimated hours
- Crew size and composition
- Conditions encountered
- What slowed things down
Per project:
- Total labor hours by system type
- Hours per unit (per fixture, per linear foot, per ton)
- Productivity variations by building type
Create Unit Rates
Break work into measurable units:
| Trade | Unit | Typical Range |
|---|---|---|
| Electrical | Per device/outlet | 0.5-1.5 hours |
| Electrical | Per LF conduit | 0.1-0.3 hours |
| Plumbing | Per fixture | 2-6 hours |
| Plumbing | Per LF pipe | 0.15-0.4 hours |
| HVAC | Per LF duct | 0.2-0.5 hours |
| HVAC | Per diffuser | 0.5-1.5 hours |
| Fire Protection | Per head | 0.3-0.8 hours |
These ranges are wide because conditions matter enormously.
Productivity Factors That Actually Matter
Access and Working Conditions
This is the biggest variable. Apply multipliers for:
| Condition | Factor |
|---|---|
| Open/new construction | 1.0 (baseline) |
| Finished spaces | 1.15-1.25 |
| Occupied building | 1.25-1.50 |
| Working above 10' | 1.15-1.30 |
| Working above 20' | 1.30-1.50 |
| Congested mechanical room | 1.20-1.40 |
| Limited access (single entry) | 1.10-1.20 |
Trade Stacking
When multiple trades work in the same area:
| Number of Trades | Factor |
|---|---|
| 1-2 trades | 1.0 |
| 3-4 trades | 1.10-1.20 |
| 5+ trades | 1.25-1.40 |
Schedule Compression
Overtime and acceleration kill productivity:
| Schedule Condition | Factor |
|---|---|
| Normal 40-hour weeks | 1.0 |
| 50-hour weeks | 1.10-1.15 |
| 60-hour weeks | 1.20-1.30 |
| Weekend/shift work | 1.15-1.25 |
After 2-3 weeks of overtime, productivity drops further.
Weather and Season
For exterior or unconditioned work:
| Condition | Factor |
|---|---|
| Ideal conditions | 1.0 |
| Hot (90°F+) | 1.10-1.20 |
| Cold (below 40°F) | 1.15-1.25 |
| Rain/snow work | 1.20-1.40 |
Applying Factors Correctly
Don't Stack Blindly
Multiple factors don't simply multiply. If you have:
- Occupied building: 1.30
- Working at height: 1.20
- Trade stacking: 1.15
Don't calculate: 1.30 × 1.20 × 1.15 = 1.79 (79% productivity loss)
Instead, identify the dominant factor and add incrementally:
- Dominant: Occupied building = 1.30
- Height adds: +0.10
- Stacking adds: +0.08
- Combined: ~1.48 (48% productivity loss)
Project-Specific Adjustments
Review project documents for:
Schedule indicators:
- Aggressive milestones
- Multiple phases
- Night/weekend requirements
Access indicators:
- Occupied spaces noted
- Phased occupancy
- Security requirements
- Parking limitations
Coordination indicators:
- Number of trades listed
- Complex ceiling conditions
- Tight mechanical rooms
Common Estimation Mistakes
Mistake 1: Using Best-Case Productivity
Your crews hit ideal productivity maybe 20% of the time. Estimate for realistic conditions, not perfect ones.
Mistake 2: Ignoring Learning Curve
First-of-type installations take longer. If you're doing 100 identical VAV boxes, the first 10 will take longer than the last 10. But if they're all different, the learning curve never kicks in.
Mistake 3: Forgetting Support Time
Direct installation isn't the only labor:
- Material handling and staging
- Layout and coordination
- Testing and commissioning
- Punch list and cleanup
Add 10-20% for support activities.
Mistake 4: Not Adjusting for Crew Mix
A crew of journeymen works differently than a crew with apprentices. Factor in your actual crew composition.
Using AI for Labor Estimation
AI can help analyze your historical data:
I have labor hour data from 15 completed electrical projects.
Each project includes:
- Building type
- Total devices installed
- Total labor hours
- Notes on conditions

Help me identify:
1. My average hours per device by building type
2. Factors that correlate with higher labor hours
3. Projects that were outliers and why
AI can also help spot missing adjustments:
Review this project scope for factors that might affect labor productivity:
[Paste spec sections about schedule, access, phasing]

What conditions should I apply productivity factors for?
Building Your Estimation System
Step 1: Capture Historical Data
After every project, record:
- Estimated vs. actual hours by task
- Conditions encountered
- What you'd estimate differently
Step 2: Develop Base Rates
From your data, establish baseline hours per unit for:
- Standard conditions
- Your typical crews
- Your methods and tools
Step 3: Create Factor Tables
Document your productivity factors with ranges based on experience.
Step 4: Review and Adjust
Every 6-12 months:
- Compare estimates to actuals
- Identify systematic over/under estimation
- Update factors accordingly
Quick Reference Checklist
Before finalizing labor estimates:
- Are base rates from your historical data?
- Have you reviewed specs for access/phasing issues?
- Have you applied appropriate condition factors?
- Have you included support labor (handling, testing)?
- Does the total feel right for this project size?
- Have you sanity-checked against similar completed projects?
What's Next
Accurate labor estimation is foundational, but it's only part of the picture. Next, look at how to use AI to speed up material takeoffs while maintaining accuracy.
TL;DR
- Labor hours are where estimates go wrong—materials have quotes, labor has guesses
- Build productivity data from your own completed projects
- Apply factors for conditions: access, stacking, schedule, weather
- Don't multiply factors blindly—use dominant factor plus incremental additions
- Include support labor (10-20%) for handling, testing, punch list
- Review and update your rates based on actual vs. estimated results