"Is this AI thing actually working?"
Your estimator says it helps. Your PM likes it. But when the CFO asks for numbers, what do you say?
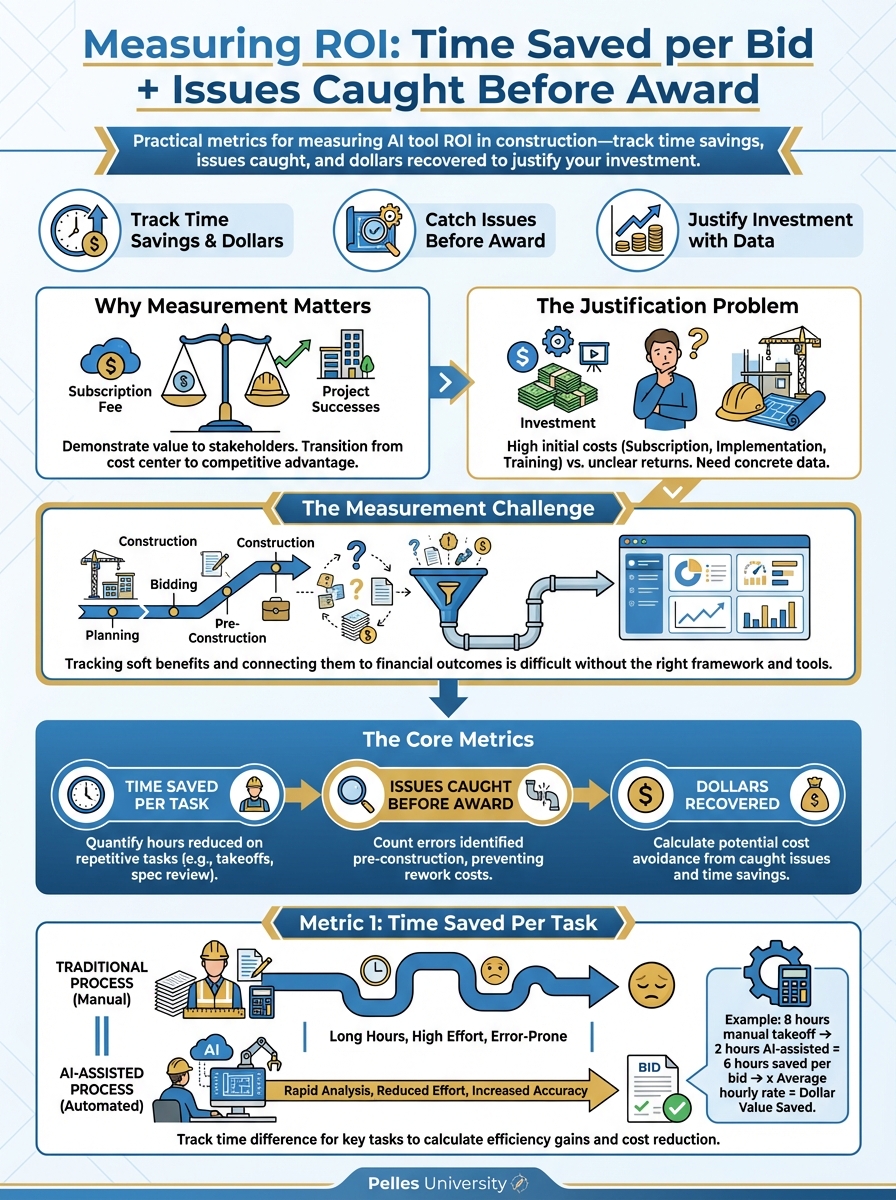
Here's how to measure the actual return on your AI investment.
Why Measurement Matters
The Justification Problem
AI tools have real costs:
- Subscription fees
- Implementation time
- Training investment
- Workflow changes
Without measurement, you can't:
- Justify continued spending
- Identify what's working
- Know where to invest more
- Make informed decisions
The Measurement Challenge
Construction outcomes are hard to attribute:
- Did we win because of better bids or market conditions?
- Was margin protected by AI or by experienced PMs?
- Would we have caught that issue anyway?
You need metrics that isolate AI contribution.
The Core Metrics
Metric 1: Time Saved Per Task
The simplest measurement. For each standardized process:
Before AI: How long did this task take? After AI: How long does it take now? Time Saved: The difference
Example: Bid Package Triage
- Before: 45 minutes average
- After: 12 minutes average
- Saved: 33 minutes per bid
Annualize it:
- Bids reviewed per year: 200
- Time saved per bid: 33 minutes
- Annual time saved: 110 hours
- Estimator hourly cost: $75
- Annual value: $8,250
Metric 2: Issues Caught Before Award
Track problems identified that would have been missed:
Categories:
- Scope gaps (work not priced)
- Specification conflicts
- Deadline issues
- Bonding/insurance problems
- Contract red flags
For each issue:
- What was caught?
- What was the potential cost if missed?
- Would it have been caught otherwise?
Example: Scope Gap Tracking
Date: March 15
Bid: ABC Hospital MEP
Issue: Specification required stainless steel drains, not standard
Potential Cost: $18,000 if missed
Caught By: AI scope check flagged material discrepancy
Would Have Caught Otherwise: Unlikely (buried in spec)
Metric 3: Change Orders Recovered
Track change orders that succeeded because of better documentation:
For each change order:
- Amount submitted
- Amount recovered
- Documentation quality score
- AI assistance used?
Compare recovery rates:
- Without AI assistance: What %?
- With AI assistance: What %?
Example:
- Pre-AI recovery rate: 65%
- Post-AI recovery rate: 82%
- Improvement: 17 percentage points
- Average CO value: $25,000
- COs per year: 40
- Additional recovery: $170,000 annually
Metric 4: Bid Win Rate
Track whether better bids lead to better outcomes:
Compare periods:
- Before AI adoption
- After AI adoption
Metrics:
- Bids submitted
- Bids won
- Win rate %
- Average margin on won work
Caution: Many factors affect win rate. Isolate by:
- Comparing similar bid types
- Tracking bid quality scores
- Noting competitive factors
Setting Up Tracking
The Simple Approach
Start with a spreadsheet:
Time Tracking Sheet
| Date | Task | Without AI (est.) | With AI | Saved | User |
|---|---|---|---|---|---|
| 3/15 | Bid triage | 45 min | 15 min | 30 min | JM |
| 3/15 | Spec lookup | 20 min | 3 min | 17 min | JM |
| 3/16 | Submittal register | 2 hrs | 30 min | 90 min | SK |
Issue Tracking Sheet
| Date | Project | Issue | Potential Cost | Caught By | Notes |
|---|---|---|---|---|---|
| 3/15 | ABC Hospital | Scope gap - SS drains | $18,000 | AI scope check | |
| 3/18 | XYZ Office | LD clause - excessive | Risk | AI contract review | Negotiated out |
What to Track
Daily (quick logging):
- Tasks performed with AI
- Estimated time without
- Actual time with
- Issues flagged
Weekly (review):
- Total time saved
- Issues caught
- Dollar impact estimated
- Patterns noticed
Monthly (analysis):
- Aggregate metrics
- Trends over time
- ROI calculations
- Improvement opportunities
Making It Stick
Tracking only works if people do it:
Make it easy:
- Simple form (30 seconds max)
- Pre-populated options
- Mobile-accessible
Make it meaningful:
- Share results regularly
- Celebrate wins
- Connect to real outcomes
Make it expected:
- Build into workflows
- Review in meetings
- Recognize contributors
Calculating ROI
Direct Cost Savings
Time savings formula:
Hours saved per month × Hourly cost = Monthly savings
Monthly savings × 12 = Annual savings
Issue avoidance formula:
Issues caught × Average cost per issue = Cost avoided
Revenue Impact
Change order improvement:
(New recovery rate - Old recovery rate) × Total CO value = Additional revenue
Bid win rate improvement:
Additional wins × Average margin = Additional profit
Total ROI
Total Annual Benefit = Time Savings + Issues Avoided + Revenue Impact

ROI = (Total Annual Benefit - Annual Cost) / Annual Cost × 100%
Example:
- Time savings: $45,000
- Issues avoided: $65,000
- Revenue impact: $85,000
- Total benefit: $195,000
- Annual tool cost: $24,000
- ROI: 712%
Avoiding Measurement Pitfalls
Pitfall 1: Overestimating "Without AI" Time
Be honest about baseline. If a task took 30 minutes before, don't claim it took 2 hours to inflate savings.
Solution: Use historical data or have someone do the task the old way occasionally for comparison.
Pitfall 2: Attribution Errors
Not everything good that happens is because of AI. Not everything bad is despite it.
Solution: Focus on direct, measurable outcomes. When attribution is unclear, note it.
Pitfall 3: Ignoring Learning Curve
Early results aren't representative. People get better with practice.
Solution: Measure baseline, then re-measure after 30, 60, 90 days.
Pitfall 4: Only Measuring Time
Time savings are easy to measure but aren't the whole story. Quality improvements and risk reduction matter too.
Solution: Track all metric categories, not just time.
Reporting Results
Monthly Summary
Share with leadership monthly:
AI Usage Summary - March 2025
| Metric | This Month | YTD |
|---|---|---|
| Tasks with AI | 145 | 412 |
| Hours saved | 38 | 108 |
| Issues caught | 12 | 29 |
| Estimated cost avoided | $43,000 | $127,000 |
| Active users | 8 | 8 |
Highlights:
- Caught $18K scope gap on ABC Hospital bid
- Reduced bid triage time by 65% average
- 100% adoption in estimating department
Opportunities:
- PM team adoption lower than target
- Field team not yet onboarded
Quarterly Review
Deeper analysis quarterly:
- Trend analysis (improving? Plateauing?)
- User-by-user adoption
- Process-by-process impact
- ROI calculation update
- Recommendations for next quarter
Annual Assessment
Full evaluation annually:
- Total ROI achieved
- Comparison to initial projections
- Expansion opportunities
- Budget recommendations
Connecting Metrics to Decisions
When Metrics Show Success
- Justify continued investment
- Expand to new processes
- Train more users
- Share success stories
When Metrics Show Problems
- Identify root causes (training? Templates? Tool fit?)
- Adjust approach
- Consider alternatives
- Don't throw good money after bad
Using Metrics for Prioritization
When deciding what to standardize next:
- Look at similar processes where AI showed high ROI
- Start with high-volume, high-impact tasks
- Avoid processes where measurement is difficult
What's Next
Measuring ROI proves value. The next step is building organizational knowledge from all this data—so insights from one project inform every future project automatically.
TL;DR
- Track four core metrics: time saved, issues caught, change orders recovered, bid win rate
- Set up simple tracking—spreadsheets work for most companies
- Calculate ROI: (Total benefit - Cost) / Cost
- Avoid pitfalls: honest baselines, clear attribution, patience for learning curves
- Report monthly, review quarterly, assess annually